[Daily Market Overview]#BTCclosed at $63814 on Tuesday. The price tested the support area of ??62000 for three consecutive times and got support. The price rebounded slightly. The overall judgment is still in a large range of fluctuations;
(Figure 1)
Technical side:
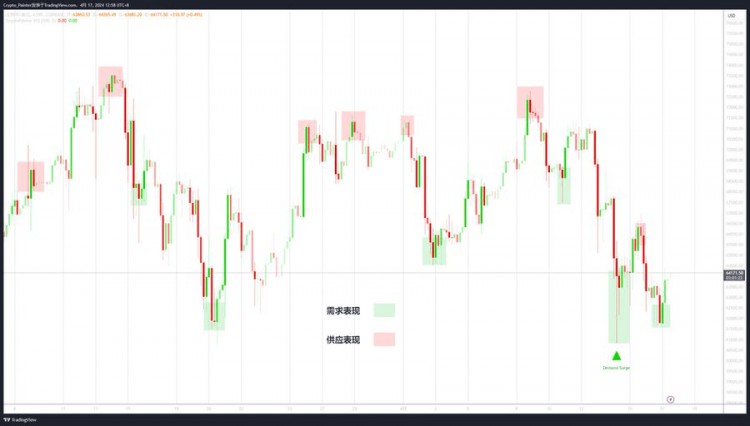
Due to the gradual blurring of price patterns, it can only be analyzed in the form of horizontal fluctuations. With the help of the VCI indicator, some obvious supply and demand areas can be seen from the market. There was a relatively obvious influx of demand at the 4h level last night, indicating that the demand price has slightly increased, which is a more favorable performance for bulls;
The current 4h line is maintaining a shrinking upward trend, and the K-line color has not yet deepened, indicating that the price has not yet reached a position with sufficient supply;
Referring to the rebound method of the price on the left, it first rose in a shrinking volume, and then suddenly there was a surge in demand. I don’t know if the current script will be repeated again. In general, the bulls have temporarily moved away from the danger zone, and one point is given to the bulls, but the price has not yet reached a higher high, so it cannot be said that this round of small-scale short-selling trend has ended;
Liquidity level:
The main liquidity magnetic areas in the past week have been concentrated around 71,700. At the same time, as the price rebounded, the long liquidity below increased slightly;
(Figure 2)
Considering the extremely low funding rate and the fact that some exchanges have reached negative values, the current magnetic area of ??71,700 is very attractive. If the price can briefly break through the left rebound high of 67,000, this part of the short liquidity will provide a lot of fuel in the futures market; Therefore, one point is given to the bulls;
On-chain data:
The amount of miners transferred in has shrunk significantly, almost to 0, and the spot supply on the disk has been obviously exhausted;
(Figure 3)
In the recent correction, the main supply is provided by the relatively short-term spot longs and futures shorts, which are affected by the news on the one hand and the shorts regain confidence on the other hand;
From the on-chain address monitoring, it can be found that investors holding 10-100 BTC have been reducing their holdings for a long time, while investors in the remaining address ranges are still maintaining a small level of continuous increase in holdings, indicating that from the perspective of on-chain spot, these 10-100 BTC holders have become the main force of selling under the guidance of emotions (I will summarize the increase and decrease of on-chain holdings in detail in the past month later);
On the other hand, the long-term low funding rate indicates that futures shorts in the market are maintaining continuous positions. An interesting point is that although the funding rate has remained at a low level for a long time, it has never deviated significantly from the value of 0. This is slightly different from the situation where the bulls are often above 0.03% during FOMO. I personally tend to believe that the overall short funds in the current market are at a low leverage ratio, and it is expected that many of them are simply hedged funds;
Therefore, based on the on-chain data analysis, it is still possible to give a point to the bulls;
ETFs net inflow data:
(Figure 4)
The net inflow data on Tuesday was -58 million US dollars. From the above indicator, it can be seen that the overall inflow level of the current ETF has been flattened, and the continuous small net outflow is not only reflected in Grayscale;
Yesterday, Wood Sister's ARK also saw a small reduction in holdings. The last time such a slightly higher net outflow occurred was in the callback on April 2. In the short term, the incremental liquidity brought by ETFs has been exhausted. If we look closely at the above figure, we can find that the area marked by the white rectangle is the area where the net inflow of ETFs has been relatively concentrated and large since March. After summarizing the Coinbase spot data using the fixed interval VPVR;
It can be found that since March, the main chip accumulation position of the entire market, including ETFs, is located near the previous rebound high of US$67,000. According to the current price of US$64,250, ETF investors who entered the market after March are currently in an average loss situation;
Of course, many people say that the funds behind ETFs are just for building positions and will not care about this retracement, but I want to say that since there are real investors behind ETFs, there must be selling if there is buying. Yesterday's net outflow of ARK shows that the investors behind ETFs are not monolithic, but there may be differences.
If the price falls sharply one day in the future, and there happens to be a net outflow in ETFs, especially BlackRock, it will be a huge blow to market sentiment;
Therefore, based on the performance of ETF data, I tend to give shorts 2 points;
To sum up
Long: 45
Short: 44